Note
Click here to download the full example code
Plotting memory consumptions
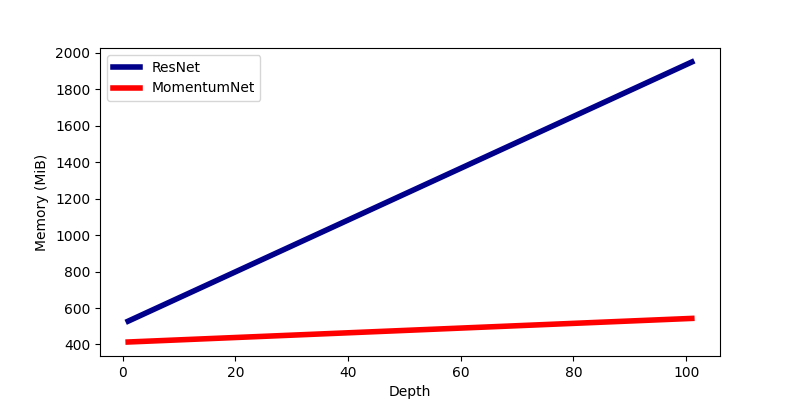
This example compares memory used when using a ResNet or a Momentum ResNet as a function of their depth
# Authors: Michael Sander, Pierre Ablin
# License: MIT

import torch
import torch.nn as nn
from momentumnet import MomentumNet
import matplotlib.pyplot as plt
from memory_profiler import memory_usage
import numpy as np

device = torch.device("cuda:0" if torch.cuda.is_available() else "cpu")
Fix random seed for reproducible figures
torch.manual_seed(1)
Out:
<torch._C.Generator object at 0x7f4846338a90>
Parameters of the simulation
Depths = np.arange(1, 200, 100)


hidden = 1
d = 2

function = nn.Sequential(nn.Linear(d, hidden), nn.Tanh(), nn.Linear(hidden, d))
function_res = nn.Sequential(
    nn.Linear(d, hidden), nn.Tanh(), nn.Linear(hidden, d)
)

X = torch.rand(2, 200000, d)


def train(net):
    Loss = (net(X) ** 2).mean()
    Loss.backward()


Mem_list_mom = []

for n_iters in Depths:

    mom_net = MomentumNet(
        [
            function,
        ]
        * n_iters,
        gamma=1 - 1 / (50 * n_iters),
        init_speed=0,
        use_backprop=False,
    )
    used_mem = np.max(memory_usage((train, (mom_net,))))
    Mem_list_mom.append(used_mem)

Mem_list_res = []

for n_iters in Depths:

    res_net = MomentumNet(
        [
            function_res,
        ]
        * n_iters,
        gamma=0.0,
        init_speed=0,
        use_backprop=True,
    )
    used_mem = np.max(memory_usage((train, (res_net,))))
    Mem_list_res.append(used_mem)

plt.figure(figsize=(8, 4))

plt.plot(Depths, Mem_list_res, label="ResNet", linewidth=4, color="darkblue")
plt.plot(Depths, Mem_list_mom, label="MomentumNet", linewidth=4, color="red")
y_ = plt.ylabel("Memory (MiB)")
x_ = plt.xlabel("Depth")
plt.legend()
plt.show()
Total running time of the script: ( 3 minutes 14.555 seconds)
